

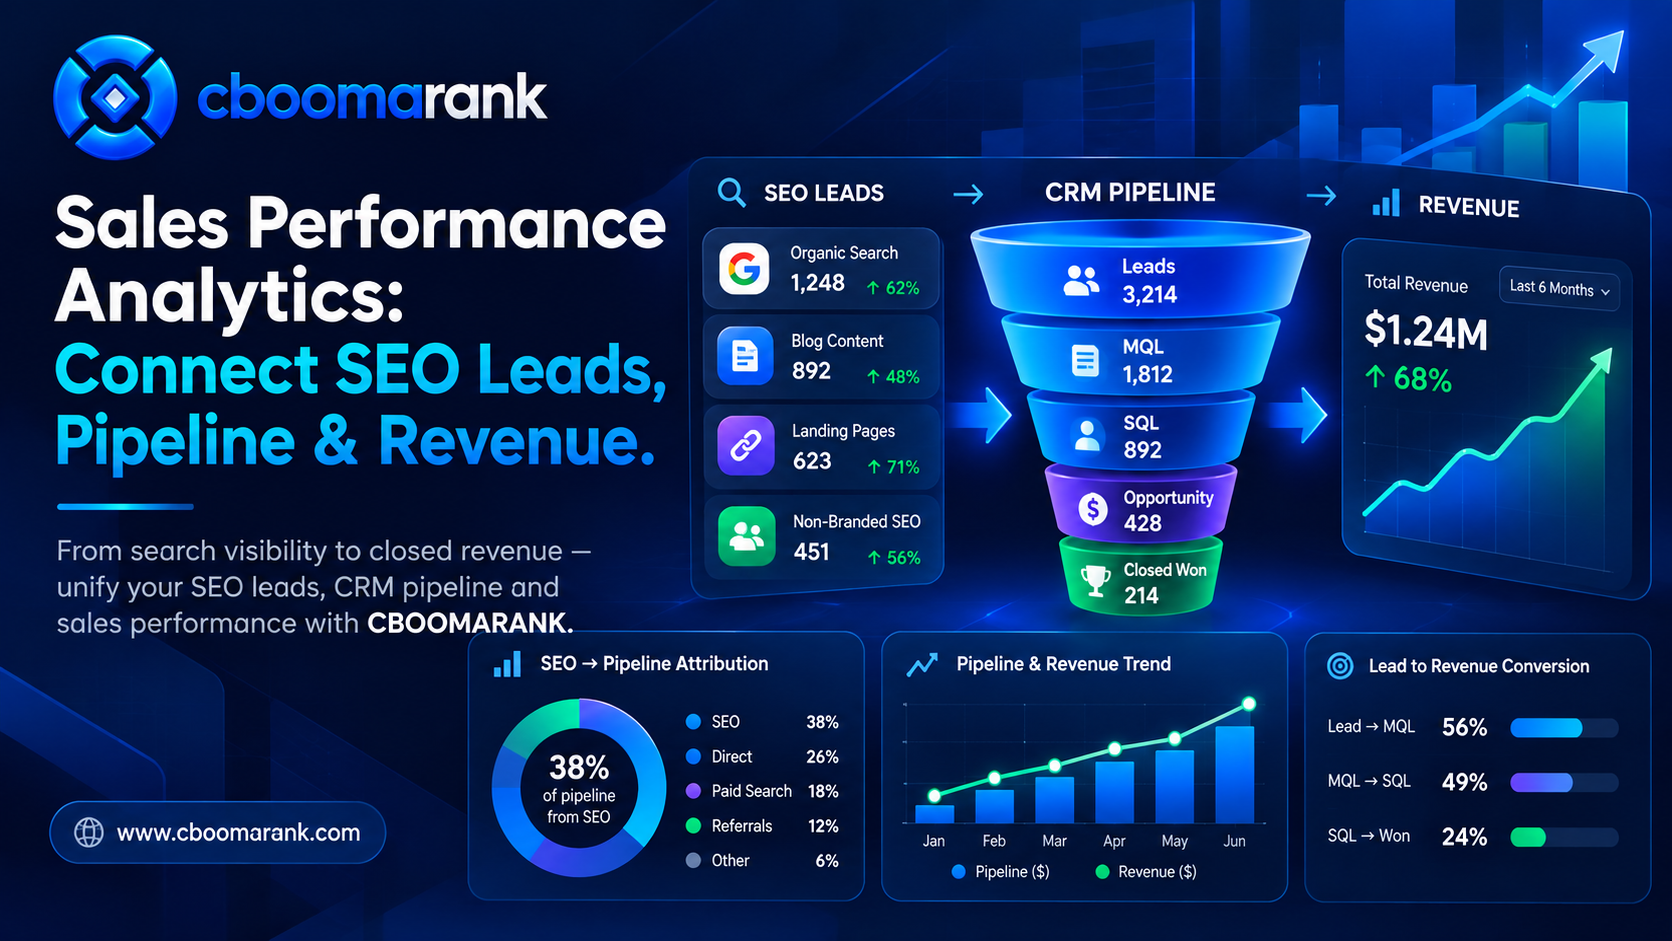
Sales performance should not be measured only by the number of deals closed. For businesses that depend on search visibility, content marketing and digital acquisition, the more useful question is how marketing activity moves from discovery to qualified leads, pipeline and revenue.
That connection is especially important for SEO. A page may generate thousands of impressions and hundreds of clicks, yet still contribute little to the sales pipeline. Another page may attract far less traffic but produce high-value enquiries that eventually become customers. Without a clear measurement framework, both pages can look equally successful or equally weak for the wrong reasons.
This guide explains how to measure sales performance from SEO leads through pipeline and revenue. It covers attribution, conversion KPIs, CRM data, reporting, pipeline analysis and practical ways to connect CBOOMARANK insights with the systems used by marketing and sales teams.
What Is Sales Performance Analytics?
Sales performance analytics is the process of measuring how effectively a business converts opportunities into revenue. It combines activity, conversion, pipeline and financial data to show where growth is coming from and where prospects are being lost.
Traditional sales reporting often starts when a lead reaches the CRM. However, digital businesses should begin earlier. Search impressions, clicks, landing pages, content interactions and lead-generation forms all influence the quality and quantity of pipeline entering the sales process.
For that reason, useful sales performance analysis connects three major layers: marketing acquisition, sales pipeline and revenue outcomes. The goal is not to force every SEO metric to become a revenue metric. Instead, the goal is to understand which search and content activities contribute to commercial progress.
Why Sales Performance Should Connect SEO to Revenue
SEO teams frequently optimize for rankings, impressions, clicks and organic sessions. Those metrics are valuable because they describe visibility and traffic. Google Search Console, for example, reports clicks, impressions, click-through rate and average position for Google Search performance.
However, those metrics do not show whether the visitor became a qualified lead, entered the pipeline or generated revenue. That information usually sits in analytics platforms, forms, CRMs and sales systems.
However, when the data remains disconnected, marketing may celebrate traffic growth while sales reports weak lead quality. Conversely, sales may report strong pipeline growth without knowing which organic pages or queries helped create it.
A connected reporting model allows both teams to evaluate the same journey. Search performance explains how prospects were discovered. Website analytics explains what happened after the click. CRM data explains whether the prospect became qualified. Pipeline reporting shows movement toward a deal, while revenue reporting confirms the final commercial outcome.
The Sales Performance Measurement Funnel
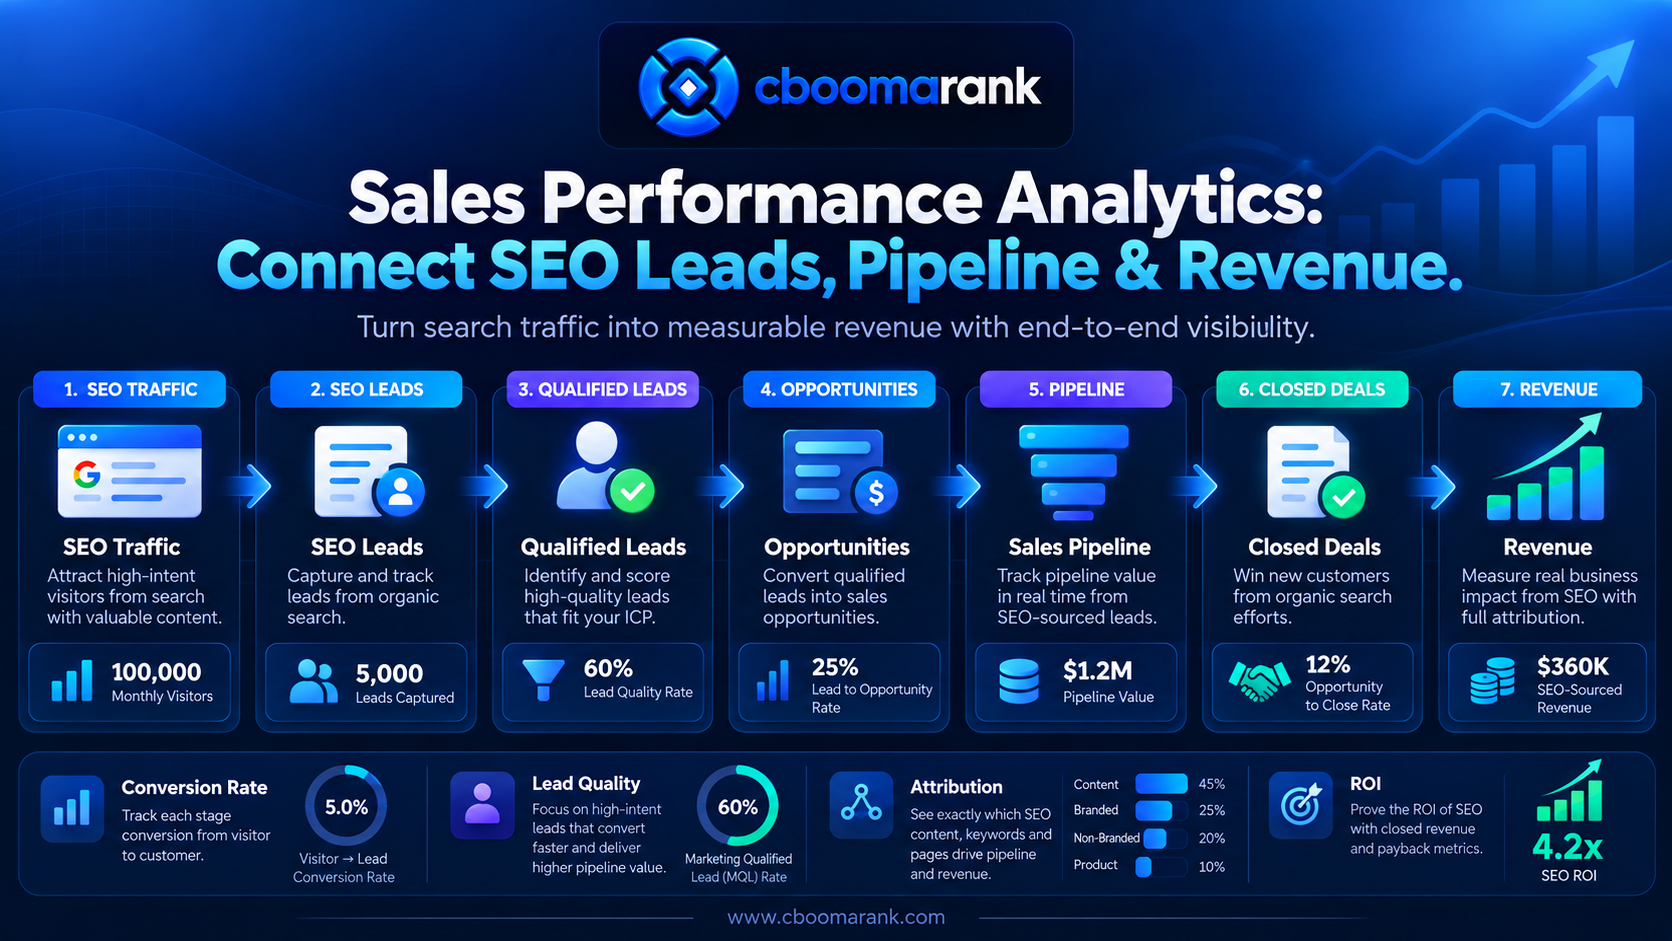
1. Search Visibility
The first layer measures whether potential customers can discover the business. Useful indicators include organic impressions, rankings, search visibility and the number of relevant queries producing exposure.
Search Console can show which queries and pages are generating impressions and clicks. CBOOMARANK can extend that view with keyword research, competitor analysis and website SEO insights. The objective is to identify whether the business is visible for topics with genuine commercial relevance.
2. Organic Traffic and Sales Performance
The next layer measures whether visibility becomes site visits. Clicks, organic sessions and landing-page traffic help identify which search results attract users to the site.
However, traffic volume alone should not determine success. Compare landing pages by intent. A high-volume educational article may support awareness, while a lower-volume service or pricing page may have much stronger commercial value.
3. Engagement and Intent
Next, after visitors arrive, measure whether they take actions associated with buying interest. Examples include viewing a product page, visiting pricing, using a website analyzer, downloading a resource, opening a contact form or creating an account.
These actions help distinguish casual traffic from visitors showing stronger intent. They also create the bridge between SEO reporting and lead-generation reporting.
4. Lead Generation and Sales Performance
A lead is created when a visitor provides enough information for the business to identify and follow up with them. Examples include contact forms, demo requests, account registrations, marketplace enquiries and quote requests.
In addition, lead volume matters, but lead quality matters more. An SEO campaign that produces 100 irrelevant enquiries can create more operational cost than a campaign producing 20 well-qualified prospects.
5. Qualified Pipeline for Sales Performance
Pipeline begins when leads meet the business criteria for genuine sales opportunities. Depending on the company, qualification may include budget, business need, authority, geography, product fit or expected purchase timing.
This is where sales performance starts becoming clearly commercial. Marketing channels can now be compared by the amount and quality of pipeline they create rather than by traffic alone.
6. Revenue and Sales Performance
The final layer measures closed business. Revenue analysis can include total sales, average deal value, customer acquisition cost, win rate, recurring revenue and customer lifetime value where applicable.
Revenue should be traced back through the journey whenever the available data allows it. That connection helps teams identify which pages, campaigns and keywords are producing profitable demand rather than simply generating attention.
Core Sales Performance KPIs to Track
Lead Conversion Rate for Sales Performance
Lead conversion rate measures the percentage of visitors or prospects who become leads. The exact denominator depends on the report. For example, a landing-page conversion rate may divide leads by landing-page sessions, while a campaign conversion rate may divide leads by campaign visitors.
Therefore, use consistent definitions. If one dashboard counts newsletter sign-ups as leads and another counts only qualified enquiries, comparisons will become misleading.
Marketing-Qualified Lead Rate
This metric shows what percentage of captured leads meet predefined marketing qualification criteria. It helps reveal whether the acquisition strategy is attracting people who match the target audience.
A rising lead count with a falling qualification rate can indicate that content is becoming broader but less commercially relevant.
Sales-Qualified Lead Rate
Sales-qualified lead rate measures the percentage of leads accepted by sales as realistic opportunities. It is particularly useful for evaluating SEO pages that target commercial or transactional intent.
If organic traffic grows while sales-qualified leads remain flat, review the search intent, targeting, calls to action and lead forms associated with that traffic.
Pipeline Conversion Rate
Pipeline conversion rate measures how effectively qualified opportunities move from one sales stage to the next. Common stages include discovery, qualification, proposal, negotiation and closed-won.
For example, stage-level conversion rates help identify bottlenecks. For example, strong qualification but weak proposal acceptance may indicate a positioning, pricing or sales-execution issue rather than a traffic problem.
Win Rate
Win rate measures the percentage of qualified opportunities that become customers. Compare win rate by source, landing page, campaign and customer segment where the data volume is sufficient.
Organic leads may sometimes close differently from paid, referral or marketplace leads because the research journey and intent can differ by channel.
Average Deal Value
Average deal value shows the typical revenue generated by a closed opportunity. This metric prevents teams from assuming that all leads or customers have equal commercial value.
A channel producing fewer deals may still deserve more investment if those deals are significantly larger or more profitable.
Sales Cycle Length
Sales cycle length measures the time between a defined starting point and a closed deal. The starting point might be lead creation, qualification or first sales contact.
Similarly, monitoring sales cycle length by source can reveal whether some acquisition channels produce buyers who are closer to a decision.
Pipeline Revenue
Pipeline revenue represents the potential value of active opportunities. Some organizations report raw pipeline value, while others use probability-weighted pipeline based on sales stages.
The most important requirement is consistency. Document how pipeline value is calculated so marketing and sales teams interpret the figure in the same way.
How Search Console Supports Sales Performance Analysis
Google Search Console provides the organic search layer of the measurement model. Its Performance report includes clicks, impressions, CTR and average position, and data can be grouped by dimensions such as queries, pages, countries, devices and dates.
Use this data to identify which landing pages generate search demand before connecting those pages to downstream analytics. For example, a service page may receive only a small share of total organic traffic but may be responsible for a meaningful share of qualified leads.
Google’s documentation explains the Performance report and how its metrics are calculated: Google Search Console Performance report.
Therefore, Search Console is most useful when treated as the beginning of the commercial journey rather than the end of SEO reporting.
How Analytics Connects Search Traffic to Conversions
Web analytics provides the next layer. It can show which landing pages visitors enter through, what actions they take and which key events occur before conversion.
Google Analytics also provides attribution reporting. Attribution models distribute credit across interactions differently, and Google’s data-driven attribution uses account data to evaluate the contribution of touchpoints to key events.
Review Google’s current attribution guidance here: Google Analytics attribution documentation.
However, attribution should be used as a decision aid rather than unquestioned truth. Tracking limitations, consent, cross-device journeys and offline interactions can all affect what the analytics platform can observe.
How CRM Data Completes the Sales Performance Picture
A CRM connects digital acquisition to individual leads, opportunities and customers. It provides the business context that analytics platforms usually cannot provide on their own.
Useful CRM fields can include original source, landing page, campaign, lead status, lifecycle stage, opportunity value, sales owner, close date and revenue.
HubSpot’s sales reporting tools, for example, support pipeline revenue, target attainment, sales activity and customizable performance reporting. See the HubSpot sales reporting overview.
The specific CRM matters less than the quality of the implementation. If sales representatives do not update stages consistently or source information is overwritten, downstream reports will be unreliable.
Understanding the Sales Pipeline
A sales pipeline represents the stages prospects move through during the buying process. Salesforce describes pipeline management as the process of monitoring opportunities as buyers move from prospecting toward a sale.
A practical pipeline may include:
- New lead
- Marketing qualified
- Sales qualified
- Discovery completed
- Proposal or offer sent
- Negotiation
- Closed won
- Closed lost
Salesforce provides additional guidance in its sales pipeline management guide.
The stages should reflect the actual buying process rather than copying another company’s CRM setup. Too many stages create administrative burden, while too few stages make bottlenecks difficult to diagnose.
How to Connect SEO Leads to Pipeline
Preserve the Original Landing Page
Record the first relevant landing page associated with each lead whenever possible. This allows sales outcomes to be traced back to the content or commercial page that initiated the relationship.
Preserve Acquisition Source
Store whether the lead originated from organic search, paid search, referral, social, direct traffic or another channel. Avoid replacing the original source every time a visitor returns.
Track High-Intent Page Visits
Visits to pricing, product, marketplace, contact and comparison pages can indicate stronger buying intent. These interactions can be useful when evaluating lead quality.
Use Consistent Lead IDs
A reliable identifier helps connect website activity, forms, CRM records and sales outcomes. The implementation should respect applicable privacy and data-protection requirements.
Define Qualification Rules
Marketing and sales should agree on what qualifies a lead. Shared criteria reduce disputes about lead quality and make channel comparisons more meaningful.
Where CBOOMARANK Fits in Sales Performance Analytics
CBOOMARANK contributes primarily to the search intelligence and website-performance side of the journey. It can help identify which keywords, competitors and website issues deserve attention before the resulting traffic is evaluated in analytics and CRM systems.
Use CBOOMARANK keyword research to identify search opportunities with commercial relevance. The CBOOMARANK keyword research guide explains why demand and intent should influence content planning.
Use competitor research to compare the search landscape and identify gaps. Then measure whether new content improves visibility, traffic and qualified pipeline.
The recently published marketing technology stack guide explains how SEO, analytics, CRM and automation can work together as one connected system.
For broader visibility measurement, review brand visibility measurement. When the focus shifts from visibility to commercial outcomes, the SEO results measurement guide provides additional context.
Connect SEO intelligence to measurable business growth.
Use CBOOMARANK to analyze websites, research keywords, study competitors and build reporting workflows around the opportunities that matter.
Sales Performance Attribution Models
First-Touch Attribution
First-touch attribution gives credit to the first known acquisition interaction. It is useful for understanding what originally introduced prospects to the business.
For SEO teams, this model can highlight the pages and queries that begin successful customer journeys.
Last-Touch Attribution
Last-touch attribution gives credit to the final measurable interaction before conversion. It is simple but may undervalue earlier research and discovery activity.
Multi-Touch Attribution
Multi-touch approaches distribute credit across several interactions. They can provide a more balanced view of long or complex sales journeys, although they require more complete tracking.
Revenue Attribution for Sales Performance
Revenue attribution connects marketing interactions to actual sales value. This makes it possible to compare channels by pipeline and revenue rather than by lead count alone.
No attribution model perfectly represents human decision-making. Use models to improve decisions, not to claim certainty that the available tracking cannot support.
Building a Sales Performance Dashboard
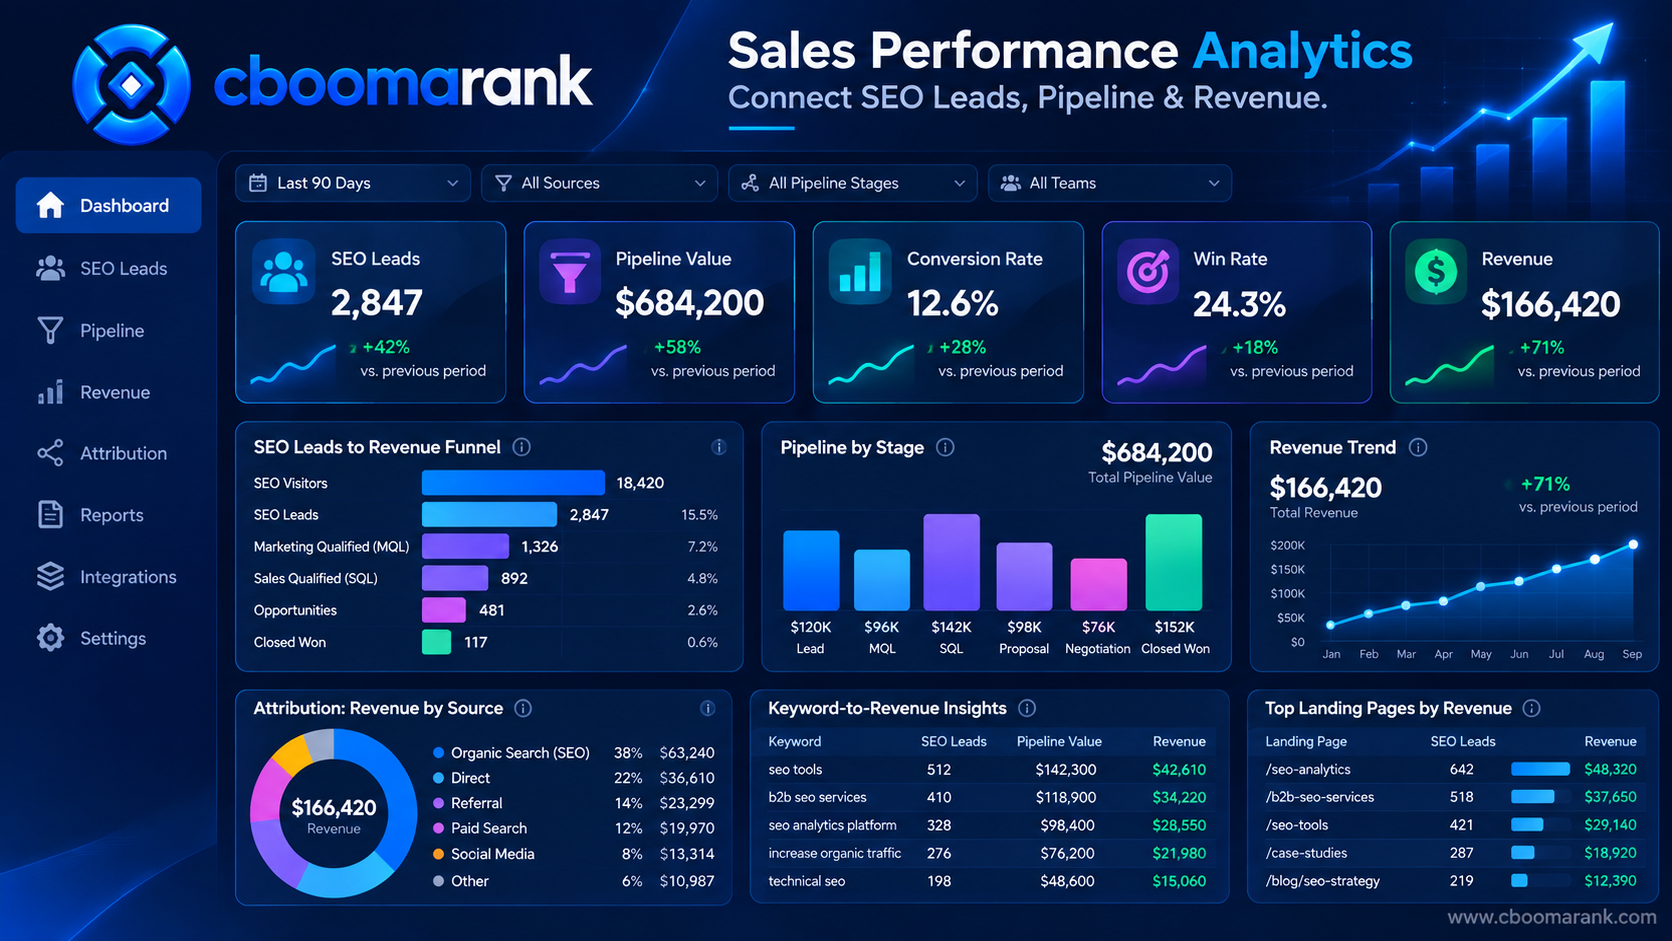
A useful dashboard should move from acquisition to commercial outcomes without overwhelming the reader. Organize metrics into layers.
| Layer | Example Metrics | Main Question |
|---|---|---|
| Search | Impressions, clicks, CTR, visibility | Are target buyers discovering us? |
| Website | Landing sessions, engagement, key events | Are visitors showing intent? |
| Leads | Lead volume, lead conversion rate | Are visitors becoming identifiable prospects? |
| Qualification | MQLs, SQLs, qualification rate | Are we attracting the right prospects? |
| Pipeline | Opportunities, pipeline value, stage conversion | Are leads becoming real sales opportunities? |
| Revenue | Win rate, deal value, closed revenue | Which acquisition efforts produce customers? |
Executive dashboards should focus on decisions. Detailed diagnostic reports can exist separately for SEO specialists, marketers and sales managers.
How to Measure Sales Performance by Landing Page
For example, landing-page reporting is one of the most practical ways to connect SEO with revenue. Group leads, opportunities and revenue by the organic landing page that brought the prospect into the site.
Compare pages using more than traffic. A useful page-level report might include impressions, clicks, organic sessions, leads, qualified leads, opportunities, pipeline value and closed revenue.
This analysis can reveal pages that appear modest in SEO reports but contribute disproportionately to commercial results. It can also reveal high-traffic pages that attract the wrong audience or fail to present a clear next step.
Use these insights to improve calls to action, internal links, page positioning and content intent. For message alignment, see the CBOOMARANK brand messaging guide.
How to Measure Sales Performance by Keyword Theme
Individual keyword attribution is often incomplete because privacy, query reporting and multi-session journeys can limit direct connections. A more practical approach is to group pages and queries into themes.
For example, a business might compare informational SEO themes, product-category themes, competitor-comparison themes and high-intent service themes.
Then evaluate each group across visibility, leads, qualification and pipeline. This provides a more stable strategic view than treating every individual keyword as an isolated revenue source.
Common Sales Performance Reporting Mistakes
Reporting Traffic Without Lead Quality
Traffic growth can look impressive while pipeline quality declines. Always connect acquisition metrics to qualification where possible.
Counting Every Form Submission as Equal
Newsletter subscriptions, support enquiries, job applications and enterprise sales requests do not have the same commercial value. Separate them in reporting.
Changing Source Data in the CRM
If the original acquisition source is overwritten when a prospect returns through another channel, first-touch analysis becomes unreliable.
Using Different Definitions Across Teams
If marketing and sales use different definitions of leads, opportunities or pipeline, dashboards will create arguments instead of clarity.
Ignoring Lost Opportunities
Closed-lost data can be extremely valuable. Record reasons such as price, timing, missing features, poor fit or competitor selection. These patterns can inform content, positioning and product strategy.
Optimizing Only for Volume
More traffic, leads or opportunities do not automatically mean better sales performance. Evaluate quality, conversion and value alongside volume.
A Practical Sales Performance Reporting Workflow
Step 1: Define the Commercial Outcome
Start with the outcome the business cares about: purchases, subscriptions, qualified opportunities, booked demos or another revenue-related event.
Step 2: Define the Funnel Stages
Document how a visitor becomes a lead, how a lead becomes qualified and how an opportunity becomes revenue.
Step 3: Connect Search and Landing-Page Data
Use Search Console and CBOOMARANK to identify the pages and topics generating relevant search visibility.
Step 4: Connect Conversion Data
Measure the actions users take after arriving. Ensure major forms, sign-ups and sales-intent events are tracked consistently.
Step 5: Connect CRM Outcomes
Store lead status, qualification, pipeline stage, opportunity value and final outcome.
Step 6: Build the Dashboard
Combine the metrics required for decisions. Avoid adding charts simply because data is available.
Step 7: Review Monthly
Compare changes in visibility, lead quality, pipeline and revenue. Investigate significant movements rather than assuming that correlation proves causation.
Sales Performance Checklist
- Organic search visibility is measured.
- Important landing pages are identified.
- Lead-generation events are tracked.
- Lead qualification rules are documented.
- Original acquisition source is preserved.
- CRM pipeline stages are consistent.
- Opportunity values are maintained.
- Closed-won and closed-lost outcomes are recorded.
- Marketing and sales definitions match.
- Reports connect acquisition to pipeline and revenue.
- Attribution limitations are documented.
- Dashboards support specific decisions.
Frequently Asked Questions About Sales Performance
What is the most important sales performance metric?
There is no single metric that works for every company. Revenue and win rate are important outcomes, while pipeline value, qualified leads and conversion rates help explain how those outcomes are produced.
Can SEO be connected directly to revenue?
Yes, in many cases SEO landing pages and lead sources can be connected to CRM and revenue data. However, the accuracy depends on tracking quality, customer journeys, consent, offline interactions and the attribution approach being used.
Should SEO teams be responsible for sales revenue?
SEO teams can influence revenue but usually do not control the entire sales process. Their reporting should show contribution to relevant traffic, leads and pipeline while acknowledging the role of sales execution, pricing, product quality and market conditions.
What is the difference between lead volume and pipeline value?
Lead volume counts the number of captured prospects. Pipeline value estimates the commercial value of active sales opportunities. A channel can generate fewer leads but more pipeline value if its prospects are better qualified or have larger potential deals.
How often should sales performance be reviewed?
Operational sales dashboards may be reviewed daily or weekly, while SEO-to-pipeline analysis often benefits from monthly and quarterly comparisons because search and longer sales cycles take time to mature.
Final Takeaway
Strong sales performance reporting connects the entire journey rather than treating SEO, marketing and sales as separate reporting systems. Search visibility creates discovery. Landing pages create engagement. Conversion paths create leads. Qualification creates pipeline, and successful sales execution creates revenue.
The most useful reporting model preserves that chain without pretending that every interaction can be measured perfectly. Combine Search Console data, analytics, CRM outcomes and sales pipeline information with clear definitions and consistent attribution practices.
CBOOMARANK can strengthen the search intelligence layer by helping businesses identify keyword opportunities, competitor visibility and website issues that influence organic acquisition. When those insights are connected to pipeline and revenue reporting, SEO becomes easier to prioritize according to commercial value rather than traffic volume alone.
Turn SEO opportunities into measurable growth decisions.
Use CBOOMARANK for website analysis, keyword research, competitor insights and reporting, then connect those insights to your lead and revenue workflow.
